Data view
Data view puts project structure and record editing in one workspace.
Open Data view to see how tables relate before you change their records. The object browser, table browser, and records grid keep the current table in context.
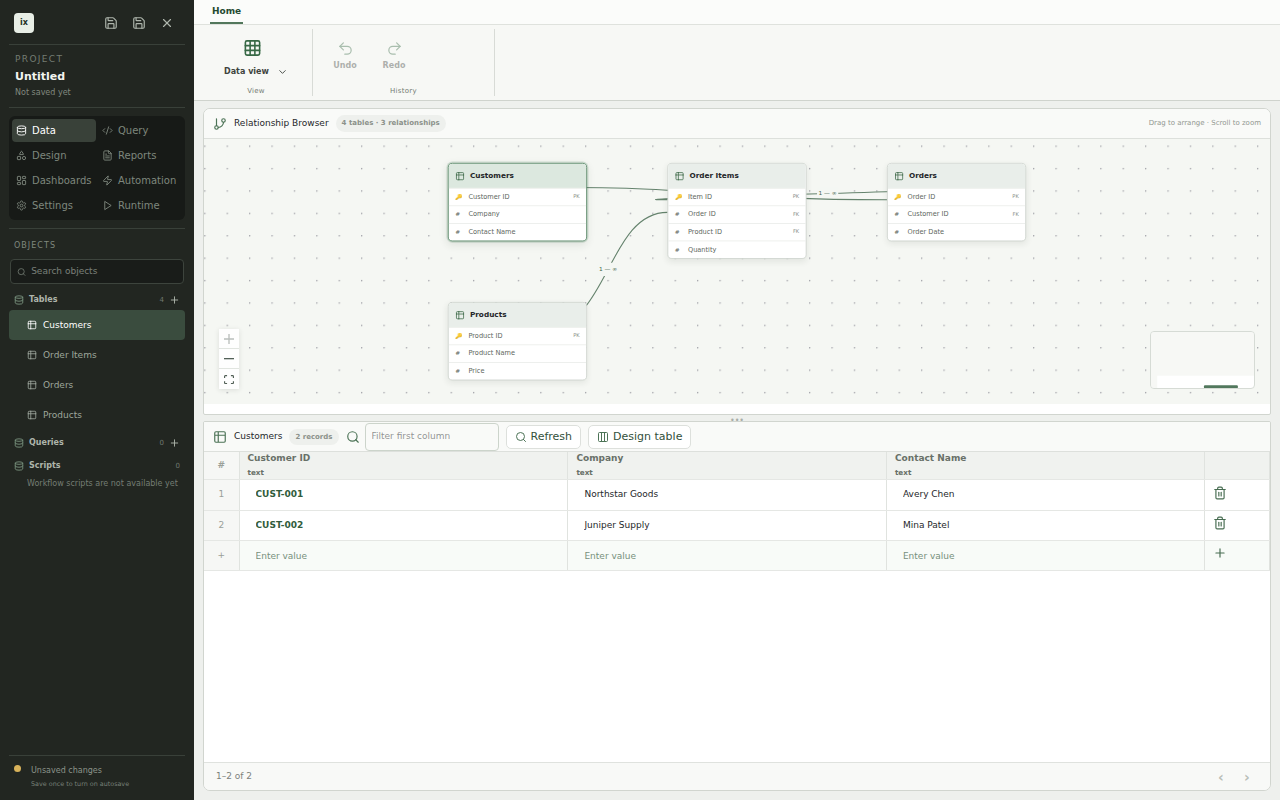
Object browser
The object browser groups tables, saved queries, and SQL scripts in the project sidebar. Select a table to make it active. Use the search field to narrow a larger project by object name.
Each table entry includes its record count. Selecting a saved query opens it in Query mode, where you edit the SQL or the visual builder and run it with parameters.
Table designer
Create a table from the object browser, then open its designer to change columns, the primary key, relationships, unique and check constraints, and indexes. Changes are staged in a pending list first. Each staged change shows whether the database applies it in place or rebuilds the table. A table rebuild or a drop shows its effect on existing rows before you apply it.
Columns use logical types such as text, integer, decimal, date, and boolean. ixtable maps each one to the matching SQLite or PostgreSQL type, so the same design works on either database.
Table browser
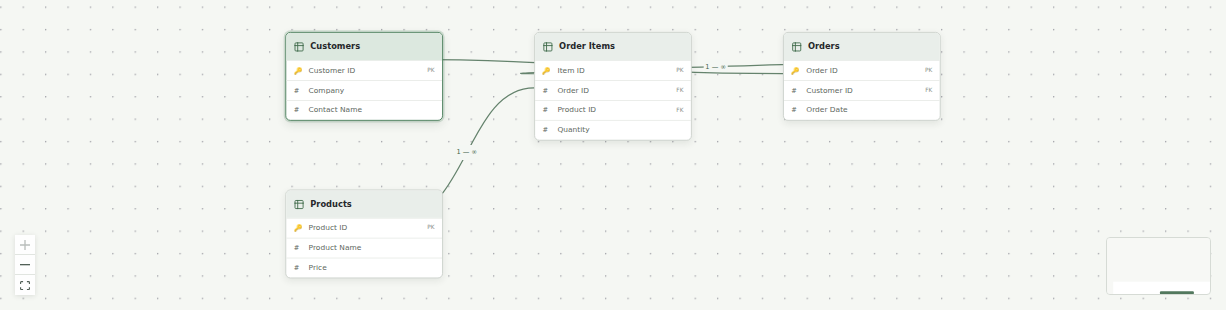
The table browser draws each table as a node with its fields. Primary and foreign keys show how records connect across the project. You can pan, zoom, and arrange the canvas while the records grid stays available below it.
Selecting Orders keeps the same table active in the object browser, relationship canvas, and records grid. That shared selection prevents the diagram and data editor from drifting into different contexts.
Records grid
The records grid displays fields as columns and records as rows. Enter values in the final draft row to add a record without opening another screen.
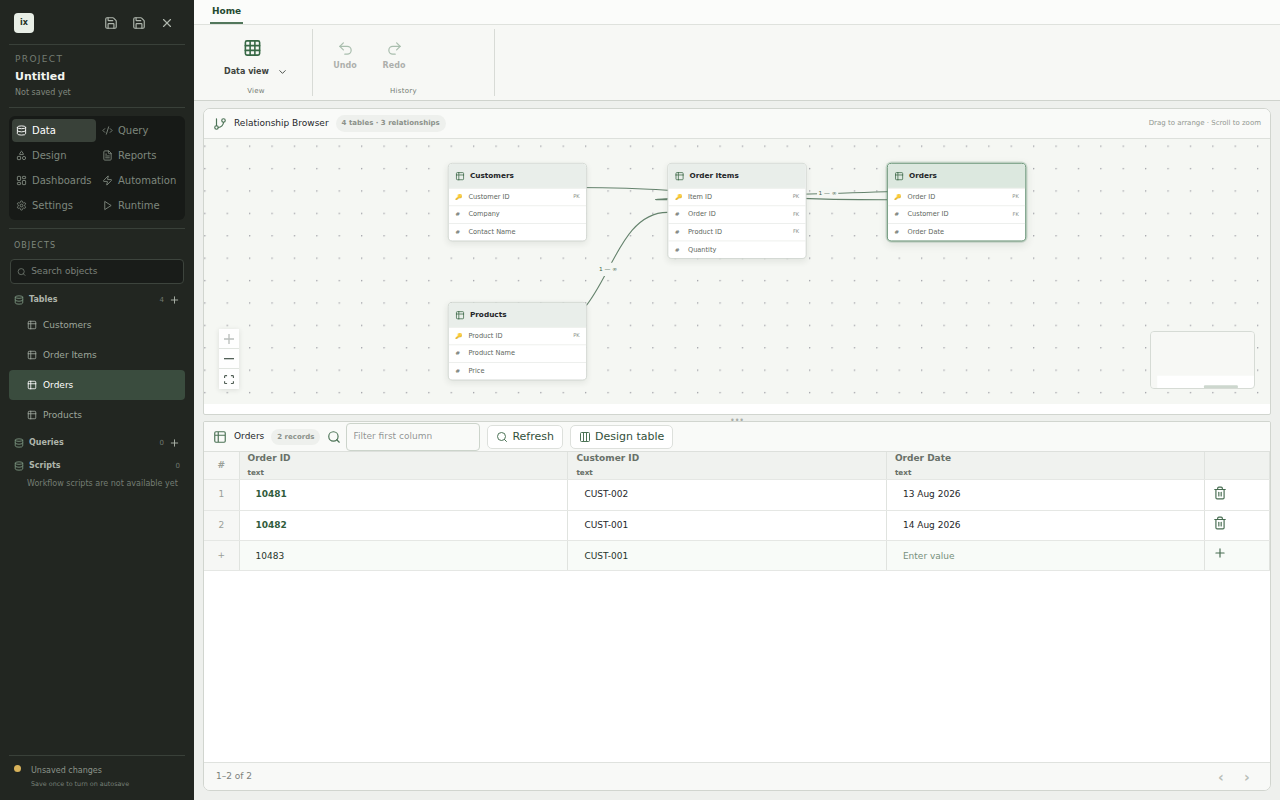
The screenshot shows a draft order with ORD-10483 and CUST-001. The active row stays aligned with the fields above it so you can compare the new values with existing records.
Each edit is written to the database at once. Constraint failures, such as a duplicate key or a missing related record, appear next to the grid and leave the record unchanged. Tables with optimistic concurrency reject an edit made from stale values and show the current ones. Page through large tables with the previous and next page buttons.
Import records
Select Import records above the table browser to load a CSV, XLSX, JSON, or Parquet file. The wizard shows the first rows and the type it found for each column. For a CSV file you can turn off the header row or set the delimiter. For an XLSX file you pick the worksheet.
Import into a new table or an existing one. A new table gets the columns you keep, with the names and types you choose, and an id key unless you pick a column as the key. For an existing table, each file column maps to a field or is skipped. Columns with the same name map on their own.
Each value is checked against the type of its field before it is written. A row with a bad value, an empty required field, or a broken constraint such as a duplicate key is skipped. The report lists each skipped row with its field and the reason. The other rows are saved. Record triggers do not run for imported rows.
File sources
A file source keeps a CSV, JSON, or Parquet file inside the project and reads it like a table. Add one in Settings, File sources, then query it as files.<name> in saved queries, reports, and dashboards. A file source is read-only. To edit its rows, import the file into a table instead.
Ribbon commands
The ribbon groups workspace actions by task. The View control switches between every mode, and Undo and Redo apply to design changes across the project. Record edits are not part of undo, because they are already saved in the database.